How to Create A Professional RF Coverage Map with Radio Mobile Online
Ever wondered how to visualize the RF coverage of a potential repeater site or the simplex range from your home station? Whether you’re testing a new antenna setup, planning a repeater installation, or simply curious about your station’s range, RF coverage maps can provide the answers you need.
Good news: you can generate these maps quickly and easily using Radio Mobile Online, a free, web-based tool created by Roger Coudé (VE2DBE). Designed specifically for the ham radio community, this tool uses advanced propagation models and digital terrain data to simulate radio transmissions between fixed and mobile stations. With just a few simple steps, you can create highly detailed coverage maps tailored to your specific needs.
What is Radio Mobile Online?
Radio Mobile Online is a radio wave propagation prediction tool that integrates digital terrain data, land cover information, and population density to simulate radio signal behavior. With over 200 GB of combined data, it can predict coverage with remarkable accuracy in most areas. However, urban users should note that it doesn’t account for the impact of buildings, which can affect signal reliability.
The tool is highly versatile and supports frequencies ranging from 10 MHz to 250 GHz, making it suitable for a wide range of amateur radio applications. From VHF/UHF repeaters to microwave links, Radio Mobile Online provides a wealth of insights for radio enthusiasts.
Step 1: Create an Account
To get started, visit the Radio Mobile Online website and register for a free account. Registration is quick and simple—just provide your name or callsign and email address. Within moments, you’ll receive an email with your login credentials.
Once you log in, you’ll gain access to the site’s full range of features, including the ability to create and save multiple transmitter sites and coverage maps.
Step 2: Plot Your Transmitter Location
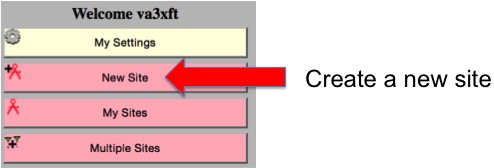
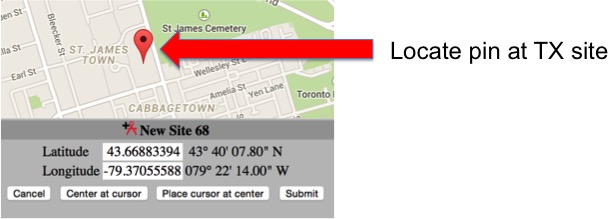
After logging in, select the “New Site” option from the left-hand menu. You’ll see a map of the world with a red pin representing your transmitter location.
How to Plot Your Location
- Manual Input: Enter the latitude and longitude of your transmitter site directly into the provided fields. This method is ideal if you already know the precise coordinates.
- Interactive Map: Drag and zoom the map to place the red pin on your desired location. Use the Satellite Viewoption for a detailed look at buildings, towers, or other landmarks.
Once the pin is positioned correctly, click “Submit” to save your site.
Step 3: Create an RF Coverage Map
With your transmitter location saved, you’re ready to generate your RF coverage map. Select the “New Coverage” option from the menu, and you’ll be presented with several input fields to define your station parameters.
Key Fields to Complete
- Centre Site: Choose your saved transmitter location from the dropdown menu.
- Antenna Height: Enter the height of your antenna above ground in meters. (Convert feet to meters by dividing by 3.28.)
- Antenna Type: Default to “Omni” unless you’re using a directional antenna.
- Frequency: Specify the operating frequency of your transmitter, from 10 MHz to 250 GHz.
- TX Power: Enter your transmitter’s output power in watts.
- Line Losses: Include feedline losses for both the transmitter (TX) and receiver (RX) to improve accuracy.
- Mobile Antenna Settings: Define the receiving antenna’s height and gain for mobile stations, also in meters and dBi.
- Maximum Range: Set the analysis range in kilometers. (Convert miles to kilometers by multiplying by 1.6.)
- RX Threshold: Specify the lowest signal strength to display on the map (e.g., -120 dBm for general sensitivity).
Refinements for Advanced Users
- Antenna Azimuth and Tilt: Adjust these if you’re using a directional or high-gain antenna to account for its beam pattern.
- Required Reliability: Increase this value for a more conservative estimate of coverage in challenging environments.
Wait for Processing
Once you’ve entered your data, click “Submit” to generate the map. The process can take anywhere from a few minutes to 20 minutes, depending on the complexity of the map and server traffic. When complete, your coverage map will display as an overlay on the terrain. Save the map by clicking “Add to my coverages.”
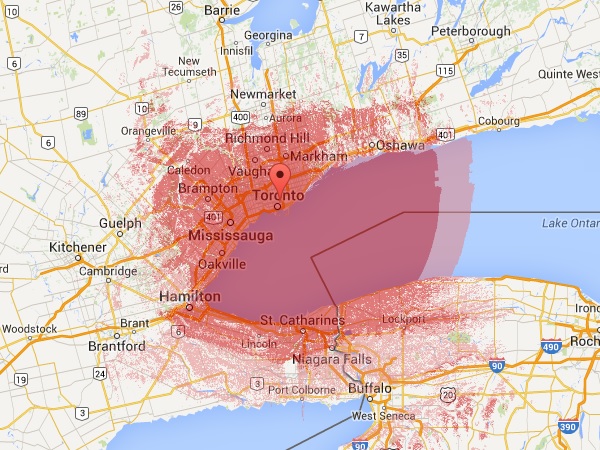
Interpreting Your RF Coverage Map
The coverage map will show areas where your signal is expected to reach with the specified parameters. Green areas typically represent stronger signals, while yellow and red indicate weaker coverage.
Things to Keep in Mind
- Urban Limitations: Coverage maps in densely populated areas may not account for building obstructions, leading to optimistic estimates.
- Terrain Influence: Hills, mountains, and valleys have a significant impact on signal propagation. Radio Mobile Online’s terrain data helps account for these factors, making its predictions reliable for rural and open areas.
Practical Applications of RF Coverage Maps
RF coverage maps can be used for a variety of amateur radio purposes, including:
- Repeater Planning: Assess potential sites to ensure maximum coverage for your community.
- Simplex Range Optimization: Fine-tune antenna height, power, and gain to maximize your station’s range.
- Microwave Links: Visualize point-to-point connections for high-frequency bands.
- Event Planning: Determine coverage for temporary stations or emergency operations.
By combining the predictive power of Radio Mobile Online with on-the-ground testing, you can achieve a comprehensive understanding of your station’s performance.
Tips for Success
- Experiment with Parameters: Small changes in antenna height or power can have a big impact on coverage. Test multiple configurations to find the best setup.
- Compare Maps: Generate coverage maps for different locations to identify the best site for your repeater or station.
- Collaborate: Share your maps with fellow hams to gather feedback or plan group projects.
Start Mapping Today!
Creating RF coverage maps has never been easier. With Radio Mobile Online, you have a powerful tool at your fingertips to visualize and optimize your station’s performance. Whether you’re planning a new repeater, testing antenna setups, or just curious about your range, this tool can help you make data-driven decisions.
Visit Radio Mobile Online today and start creating professional RF coverage maps to share with your ham community!


